Easily design bar charts with our free Bar Chart Maker. Perfect for school projects, business reports, or visualizing any kind of data—just input your values, customize colors and labels, and download instantly. No design skills needed!
Compare trends and categories side-by-side using our Bar Chart Maker with Multiple Data Sets. Great for tracking changes over time, analyzing group differences, or presenting complex data—all in a clean, customizable format. Upload your data, tweak the look, and download in seconds!
Track trends, show progress, and tell data stories with our easy-to-use Line Graph Maker. Ideal for timelines, performance metrics, or scientific data—just plug in your numbers, customize the design, and download your graph instantly. No spreadsheets required!
Track and visualize several data sets over time using our Line Chart Maker with Multiple Data Sets. Whether you’re analyzing performance, comparing categories, or telling a data story, this tool makes it easy. Input your values, customize styles, and download a clear, professional chart in minutes!
Easily create line, bar, or combo graphs to bring your data to life. Our Line and Bar Graph Maker lets you compare trends and categories in one clear visual. Perfect for reports, schoolwork, or presentations—just enter your data, customize the look, and download with a click!
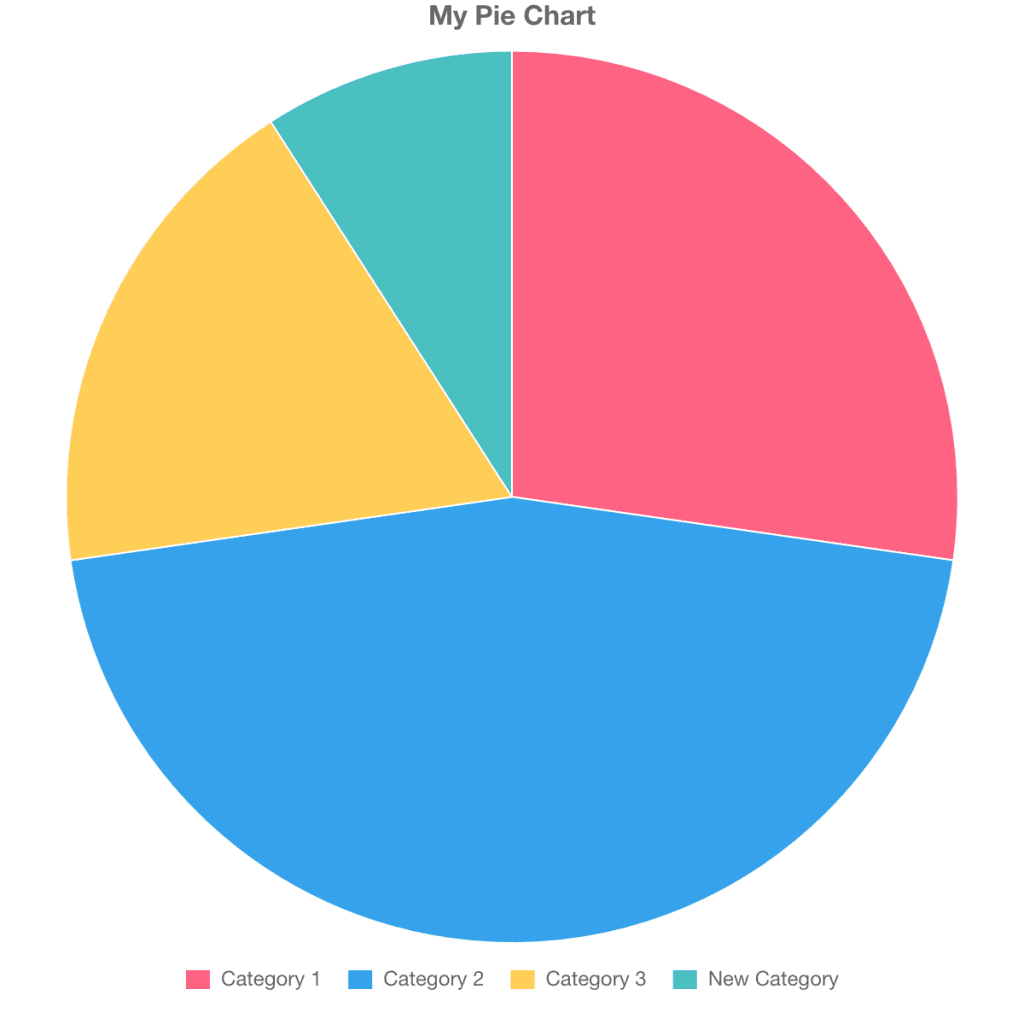
Break down your data into beautiful slices with our Pie Chart Maker. Perfect for showing percentages, proportions, or survey results—just enter your values, pick your colors, and download your chart in seconds. No design or coding needed!
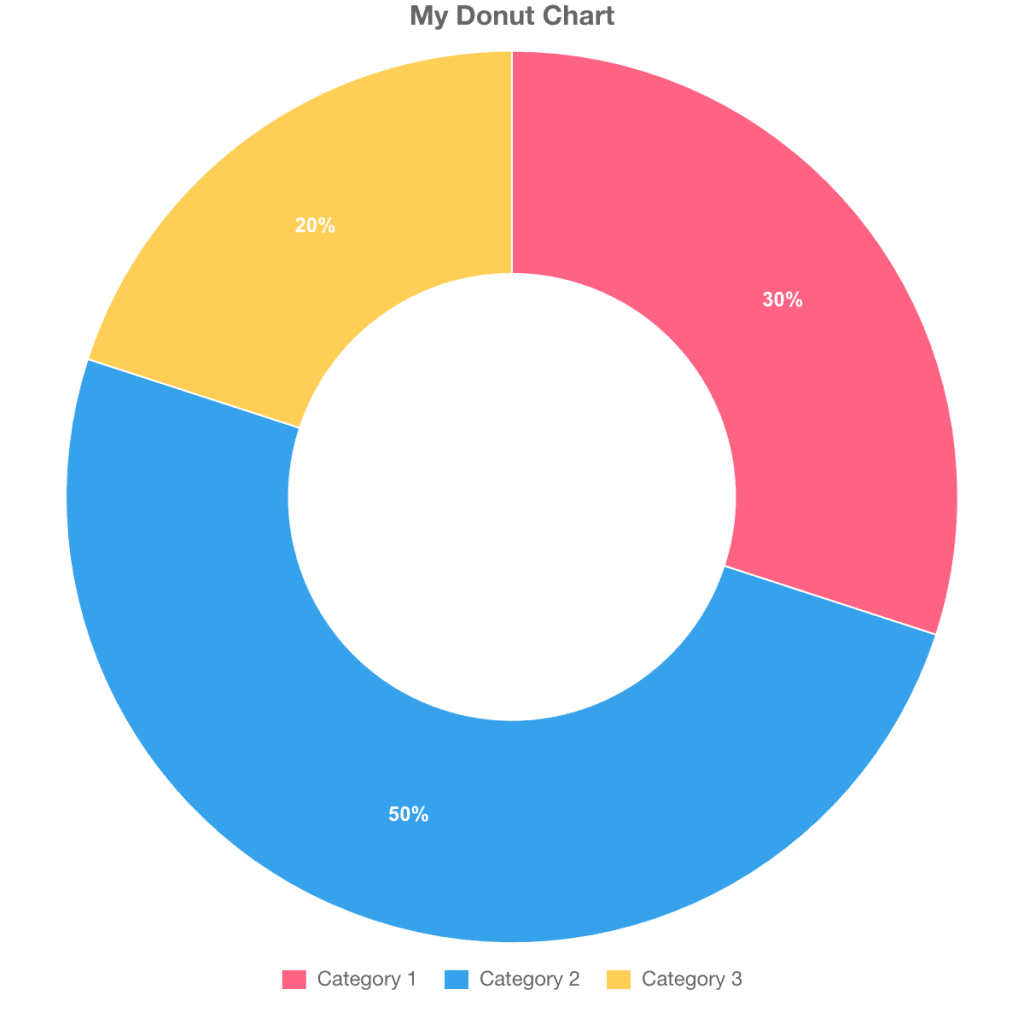
Need a sleek way to show proportions? Our Donut Chart Maker helps you visualize data with a modern twist on the classic pie chart. Customize colors, labels, and ring size—then download your chart in seconds. Perfect for reports, dashboards, and presentations!
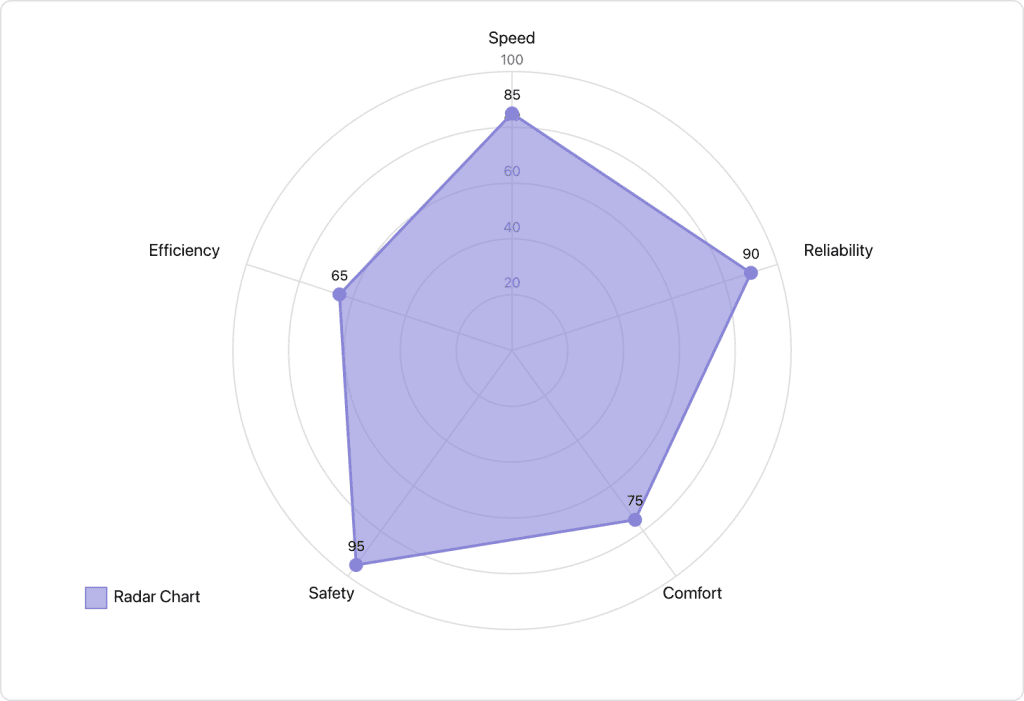
Our Radar Chart Maker lets you compare multiple variables across different categories—all in one striking, web-like graph. Great for skill assessments, performance metrics, or survey results. Just enter your data, customize the look, and download instantly!
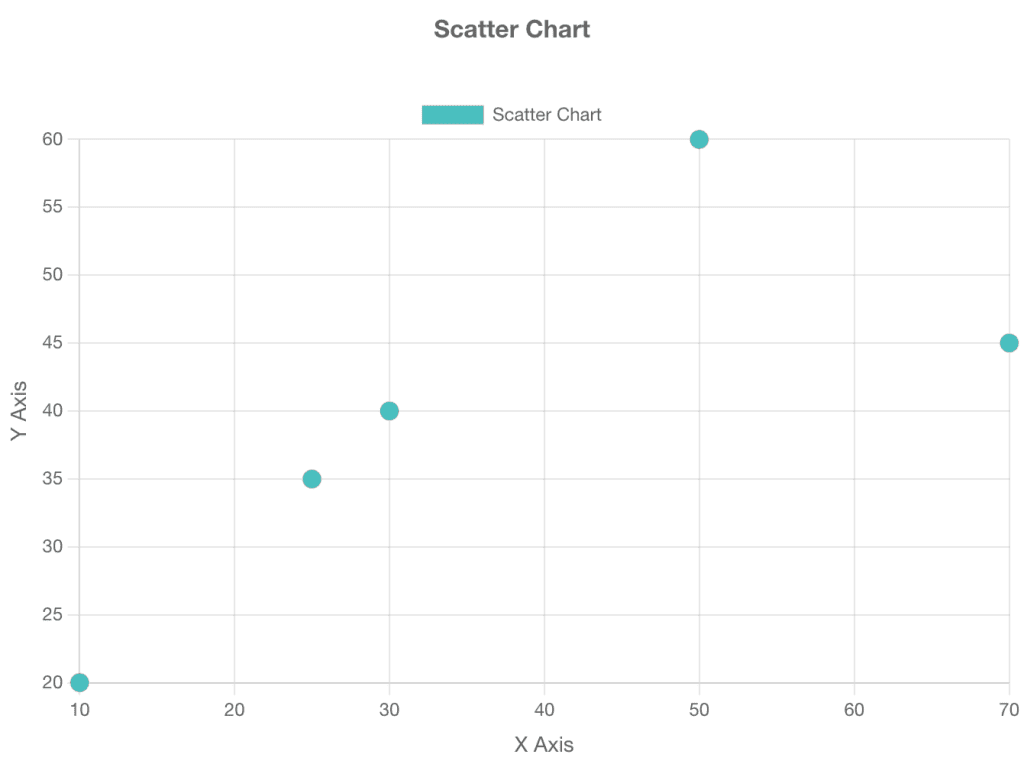
Easily create Scatter Plot graphs to visualize relationships between variables. Perfect for trend analysis, correlations, and scientific data. Just input your values, customize the design, and download a clear, professional plot in minutes!